Türkiye's population as of 2021 is 84.6 million, with a population growth rate of 12.7%. According to Turkish Statistical Institute (TurkStat) estimates, Türkiye's population is projected to be 86.9 million in 2023, 100.3 million in 2040 and 107.1 million in 2060. Alongside to population size, population structure is also very important.
Chart: Population Growth Rate and Density
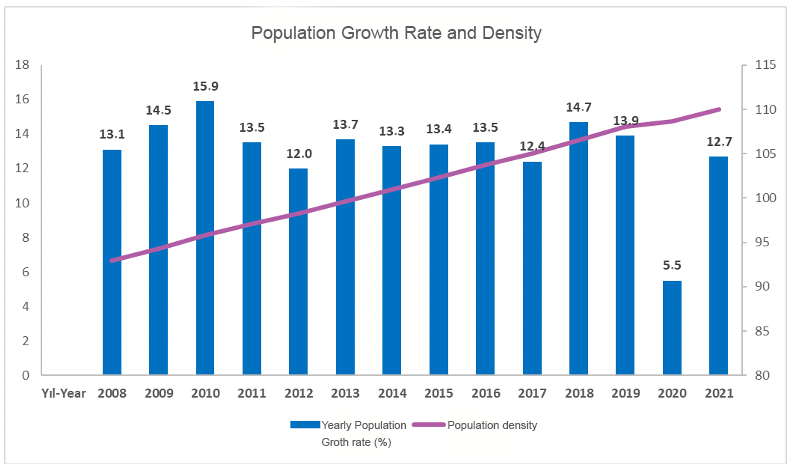
Source: TÜİK, 2022
According to TUIK (Turkish Statistical Institute) data, as of 2020, the population in the 15-64 age group constituted 67.7% of the total population, while 22.8% of the population was in the 0-14 age group and 9.5% was 65 years of age or older. When the future projections of TUIK are analyzed, it is estimated that the population in the 15-64 age group will decline to 64.4% in 2040 and 58.7% in 2080, while the elderly population over the age of 65 will increase to 16.3% in 2040 and 25.6% in 2080. Expectations point to an aging population structure in Türkiye. In OECD studies, a country is characterized as an "aging society" if the share of people aged 65 and over is between 7 and 14% of the total population, as an "old society" if this share is between 15% and 20%, and as a "super old society" if this share is 21% or higher. In this respect, while our country is already an aging society, according to TUIK's estimates, it will become a super-aging society after 2040. .
Chart: Total Population according to Age Groups and Predictions for Future, %
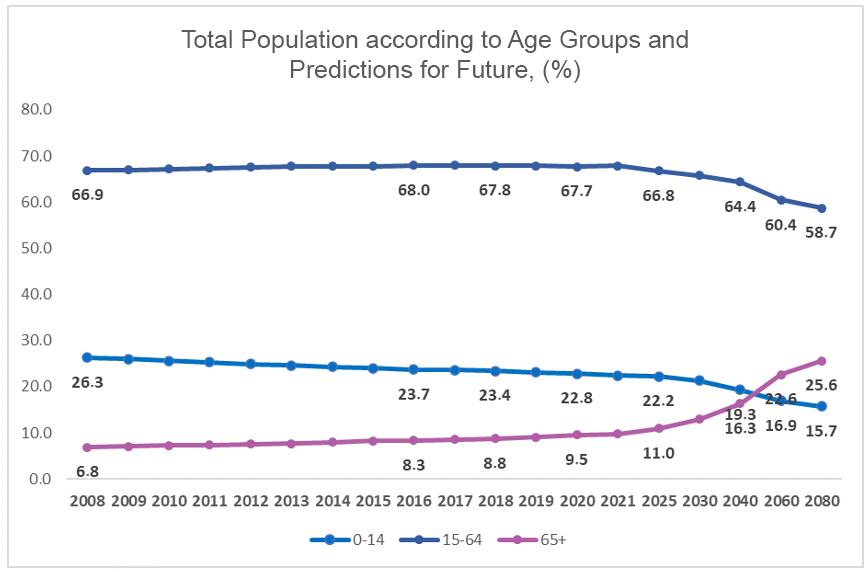
Source: TÜİK, 2022
As will be seen in the next section, the total fertility rate in Türkiye, which was 2.0 in 2018, dropped to 1.70 in 2021. As is known, a fall in the total fertility rate below 2.1 means that the population cannot renew itself. While the crude mortality rate in Türkiye has not changed much in recent years, the crude birth rate is estimated to be 12.83% as of 2021.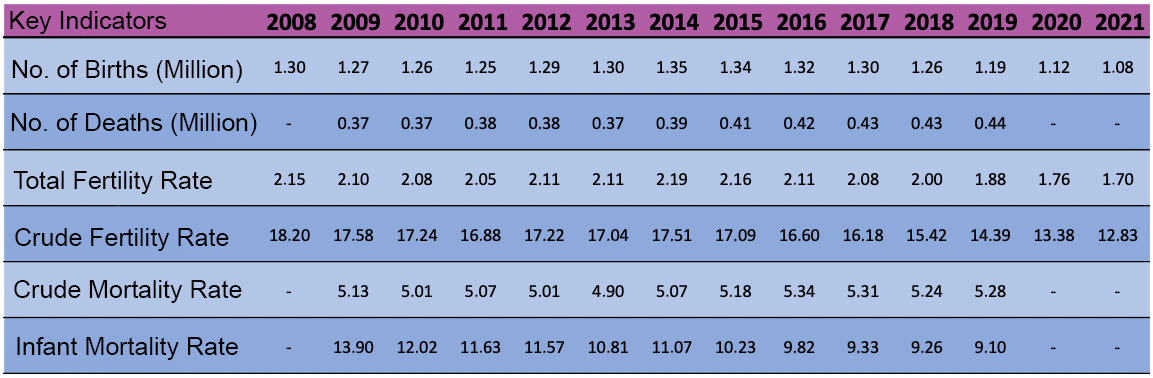
Source: TÜİK, 2022
Health has an important place in Türkiye's socio-economic development. In the 2000s, many reforms were made with health transformation programs and significant improvements in comparison with OECD data were achieved in basic health indicators such as life expectancy at birth, infant mortality rate and maternal mortality rate
Chart: Life Expectancy at Birth, years
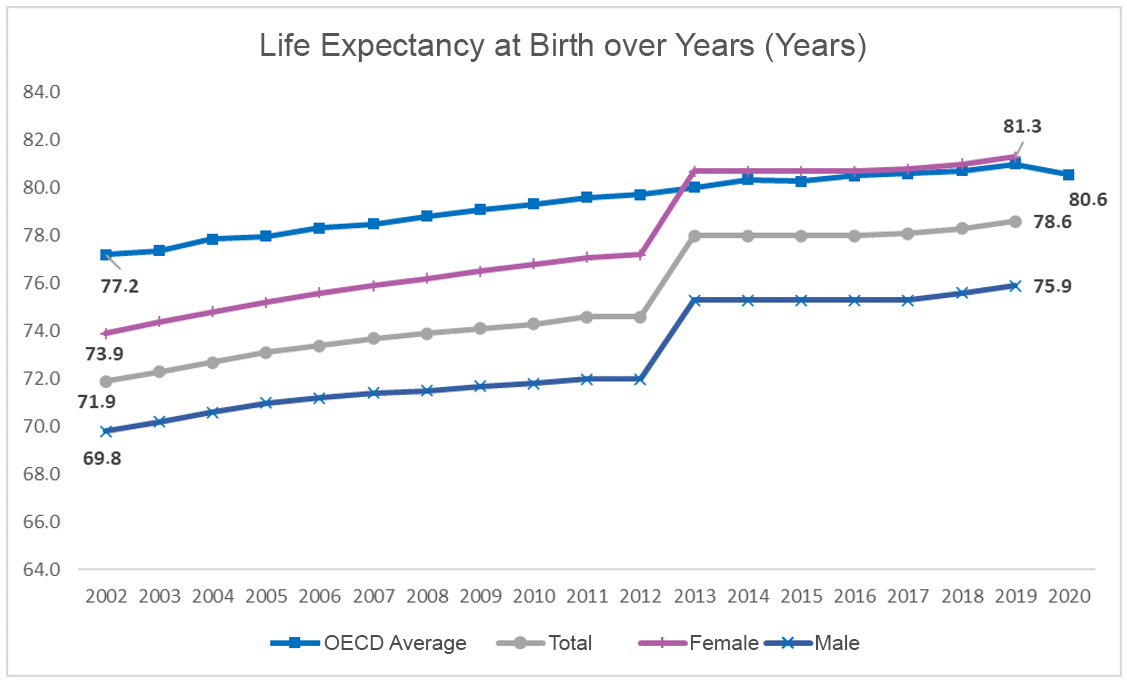
Source: OECD
Chart: Infant Mortality rates (per thousand live births)
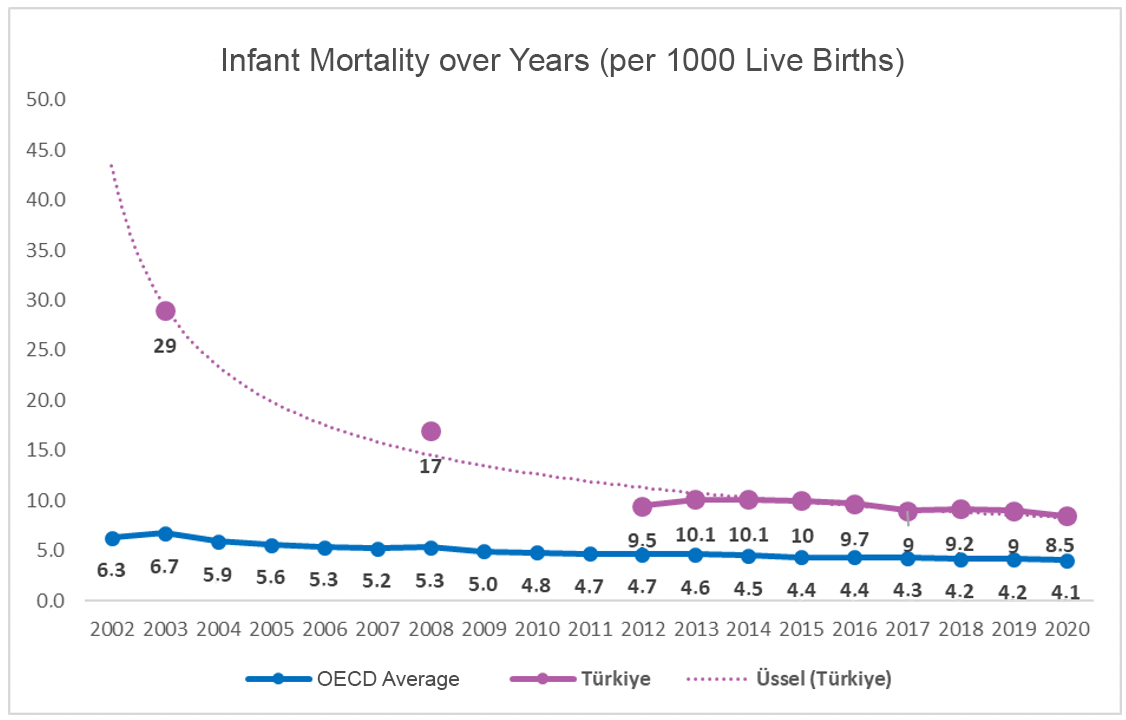
Source: OECD
Chart: Maternal Mortality rates (per 100 thousand live births)
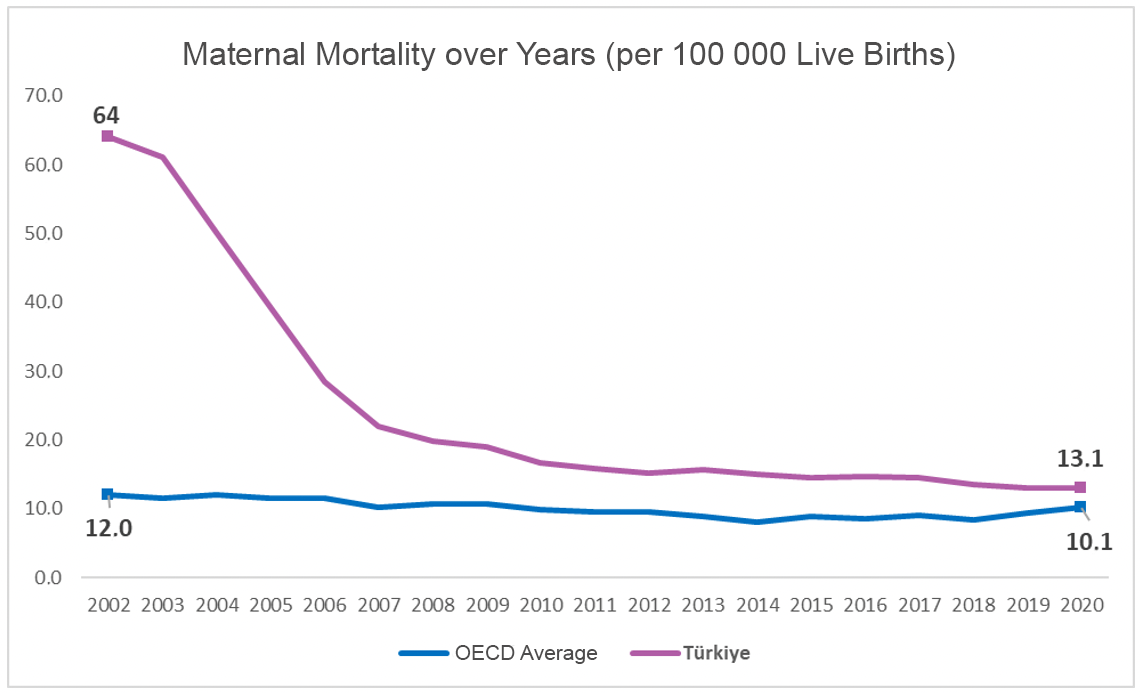
Source: OECD
Since the implementation of health reforms, compared to OECD, there are areas of improvement in access to health. For instance, the number of physicians per thousand people increased from 3 in 2002 to 3.8 in 2020, while the number of visits to physicians increased from 3.1 to 7.2; data on the number of hospitals per million people and hospital beds per thousand people also improved during the same period.
Chart: No. of Physicians per thousand people according to years
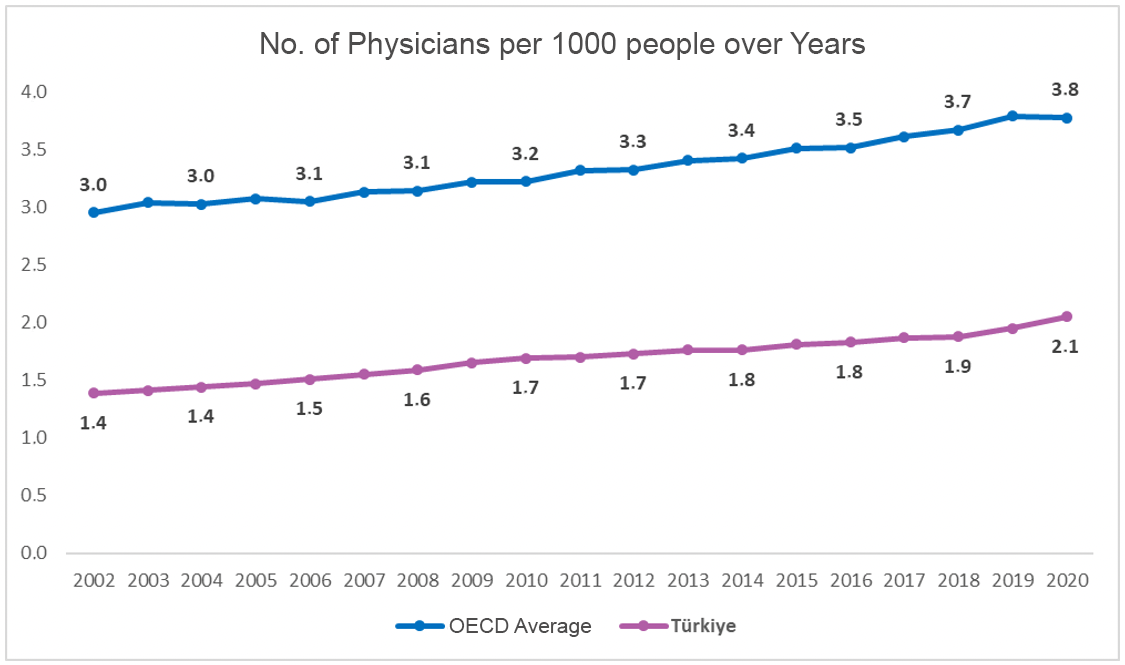
Source: OECD
Chart: Number of physician visits over years
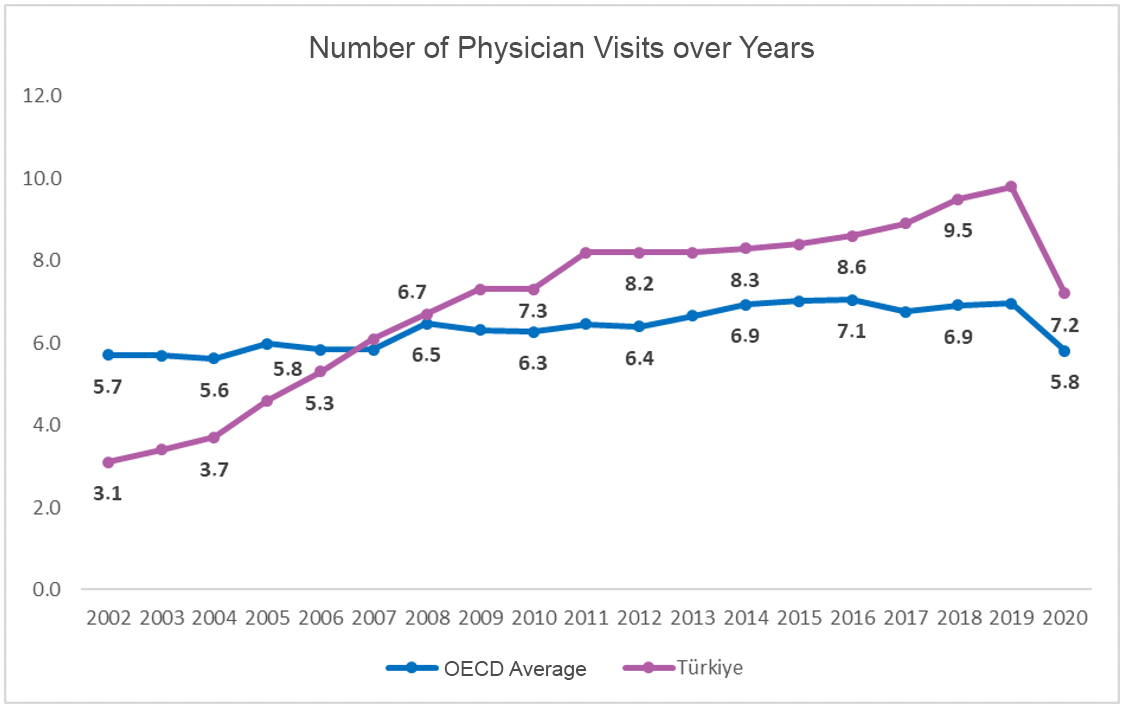
Source: OECD
Chart: No. of hospitals per millon people
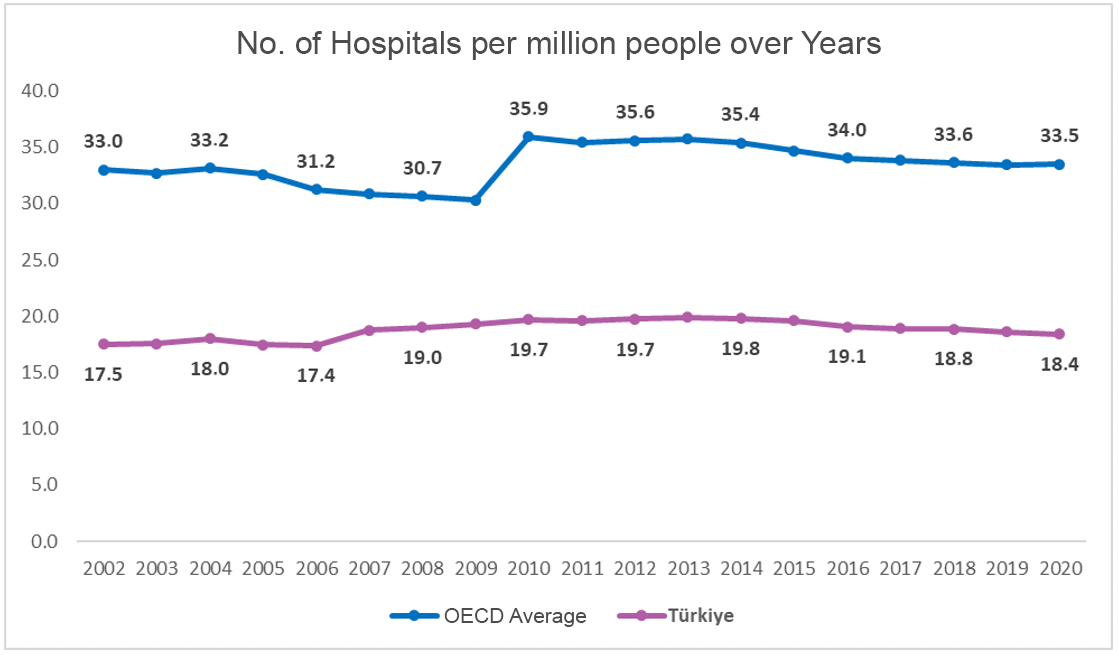
Source: OECD
Chart: No. of hospital beds per thousand people
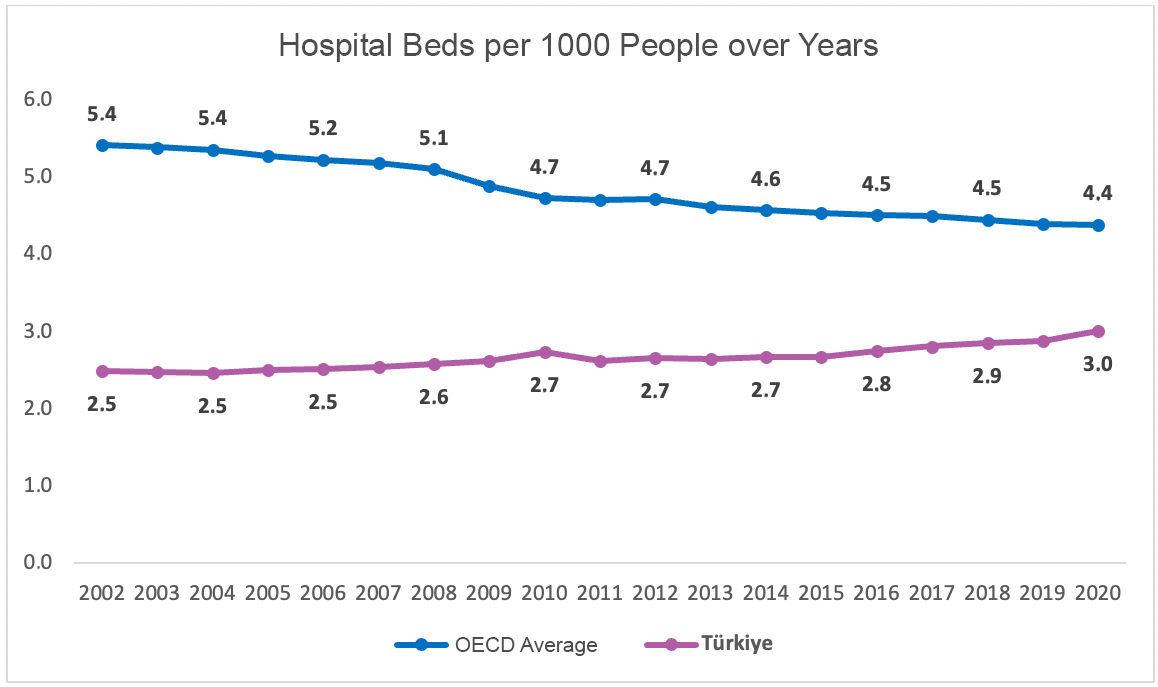
Source: OECD
The success in the field of health has been reflected in the society and the satisfaction rate with health services has increased significantly from 40% to 70%.
Chart: Satisfaction Level from Healthcare Services, %
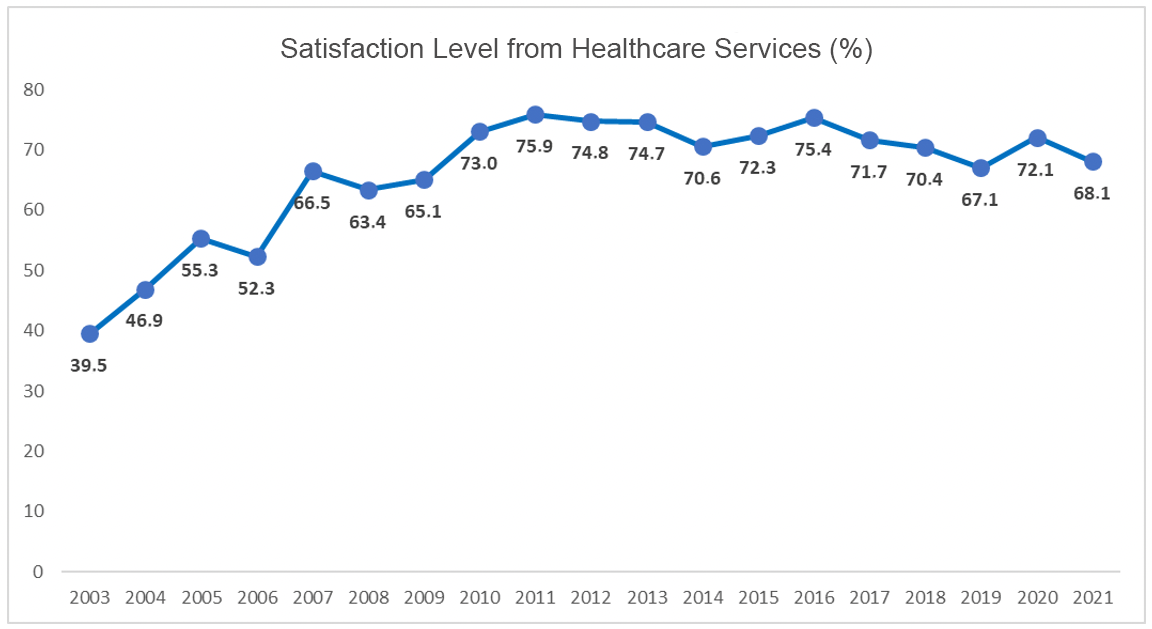
Source: TÜİK, 2022